
Children and young people
Thurrock has a young population compared with the rest of England.
7.7% of the population is 0 to 4 years-old, whilst 27.1% is 0 to 19 years-old. The number of 0 to 19 year-olds in Thurrock is expected to pass 50,500 by 2037, and may increase further as a result of the local economic growth. The proportion of children under 15 years-old is highest in Tilbury, Chafford, North Stifford, West Thurrock and parts of Ockendon.
Ethnicity
Our young population is becoming more diverse. Latest data from 2012 shows 26.5% of Thurrock school-aged children are from a black and minority ethnic group, compared with 19.1% of our total population. Thurrock has a slightly higher proportion (0.3%) of Gypsy, Roma and traveller children compared with the national population (0.2%).
Deprivation
Overall levels of deprivation in Thurrock are lower than the national average, but some areas of Thurrock are among the 20% most deprived in England.
More than 1 in 5 children under 16 years-old in Thurrock are growing up in poverty (21.2%), higher than the national rate (20.1%). Child poverty is more concentrated in the most deprived areas of Thurrock – 6% of children live in poverty in parts of Grays Thurrock and Little Thurrock Rectory, whereas the figure rises to 56.4%.in parts of Tilbury.
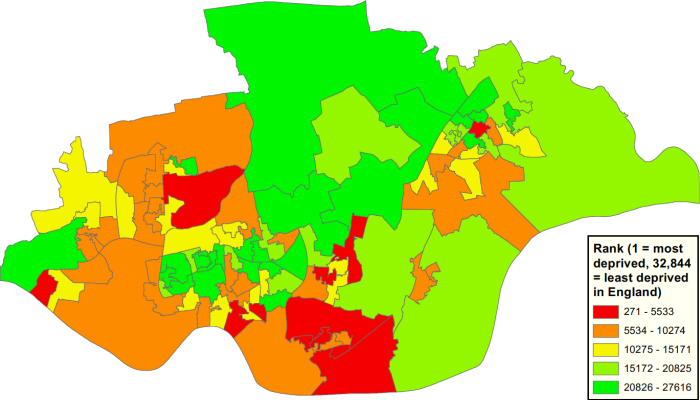
Source: Department for Communities and Local Government: Indices of Multiple Deprivation 2015.
Education, employment and training
The proportion of 16 to 19 year-olds who are not in education, employment or training (NEET) has decreased to 4.8% in recent years, but this is still higher than the national average.
| Region | 2012 | 2013 | 2014 | 2015 |
|---|---|---|---|---|
| Thurrock | 6.0% | 5.4% | 5.2% | 4.8% |
| England | 5.8% | 5.3% | 4.7% | 4.2% |
Source: Department for Education: NEET data.
Breastfeeding
Breastfeeding has health benefits for both child and mother, yet for several years the proportion of mothers who initiate breastfeeding in Thurrock has been significantly lower than the proportion across England.
| Region | 2011/12 | 2012/13 | 2013/14 | 2014/15 |
|---|---|---|---|---|
| Thurrock | 69.8% | 69.5% | not available | 71.1% |
| England | 74.0% | 73.9% | 74.0% | 74.3% |
By 6 to 8 weeks after birth, the percentage of mothers in Thurrock who breastfed their babies was 47.6% in 2015/16, which is significantly higher than the national average of 43.2%.
Source: Public Health England: Overview of child health.
Life expectancy
Life expectancy at birth in Thurrock is 78.9 years for boys and 82.6 years for girls. This compares to 79.5 years and 83.1 years nationally.
Life expectancy is lower – by 9.4 years for men and 6.5 years for women – among people living in the top 10% most deprived areas compared to those in the 10% of areas with least deprivation.
Infant and child mortality rates in Thurrock are in line with national averages.
More information
You can find more information in our Joint Strategic Needs Assessment (JSNA) and from Public Health England: Overview of child health.